How We Compare Results
Generative AI for Causal Experimentation
Subconscious.ai users can conduct human-equivalent experiments that are cheaper, faster, and more ethical than experiments using real populations, without sacrificing the validity and reliability of the results. We use Generative AI methods to design Causal Experiments, simulate respondents, and analyze results equivalent to the most well-replicated human causal studies. We have shown that our Causal Experiments have Bioequivalence - that is, we can explain as much of the variance of any human decision as the best-designed studies. Our technology has been tested across a broad swath of domains including Retail, Climate, Trade, Food Safety, Health Insurance, Higher Education, Housing, Immigration, Nutrition, Sentencing, Obesity, Organ Transplant, Pregnancy, Racism, Sexism, Ageism, Remote Work, Renewables, Self-Driving, Tax Policy, Wearables, and Culture. In this context, Bioequivalence refers to the degree to which the behavior of the synthetic population mimics the behavior of the real population. Specifically, if an experiment using a synthetic population produces similar results to an experiment using a real population, then we can say that the synthetic population is bioequivalent to the real population in terms of its behavior.
Testing for Bioequivalence
We use a Spearman rank correlation coefficient (r_{s}) to test the Bioequivalence of our synthetic experiments against those published in research papers. We randomly grouped responses from a well-replicated published experiment with 25 levels. The experimental results for each of three subsets of data compared to the others gave r_{s} between 0.52 (p= 0.86 (p< $0.001), which indicates a baseline level for agreement in the rank correlation coefficient of at least 0.52.
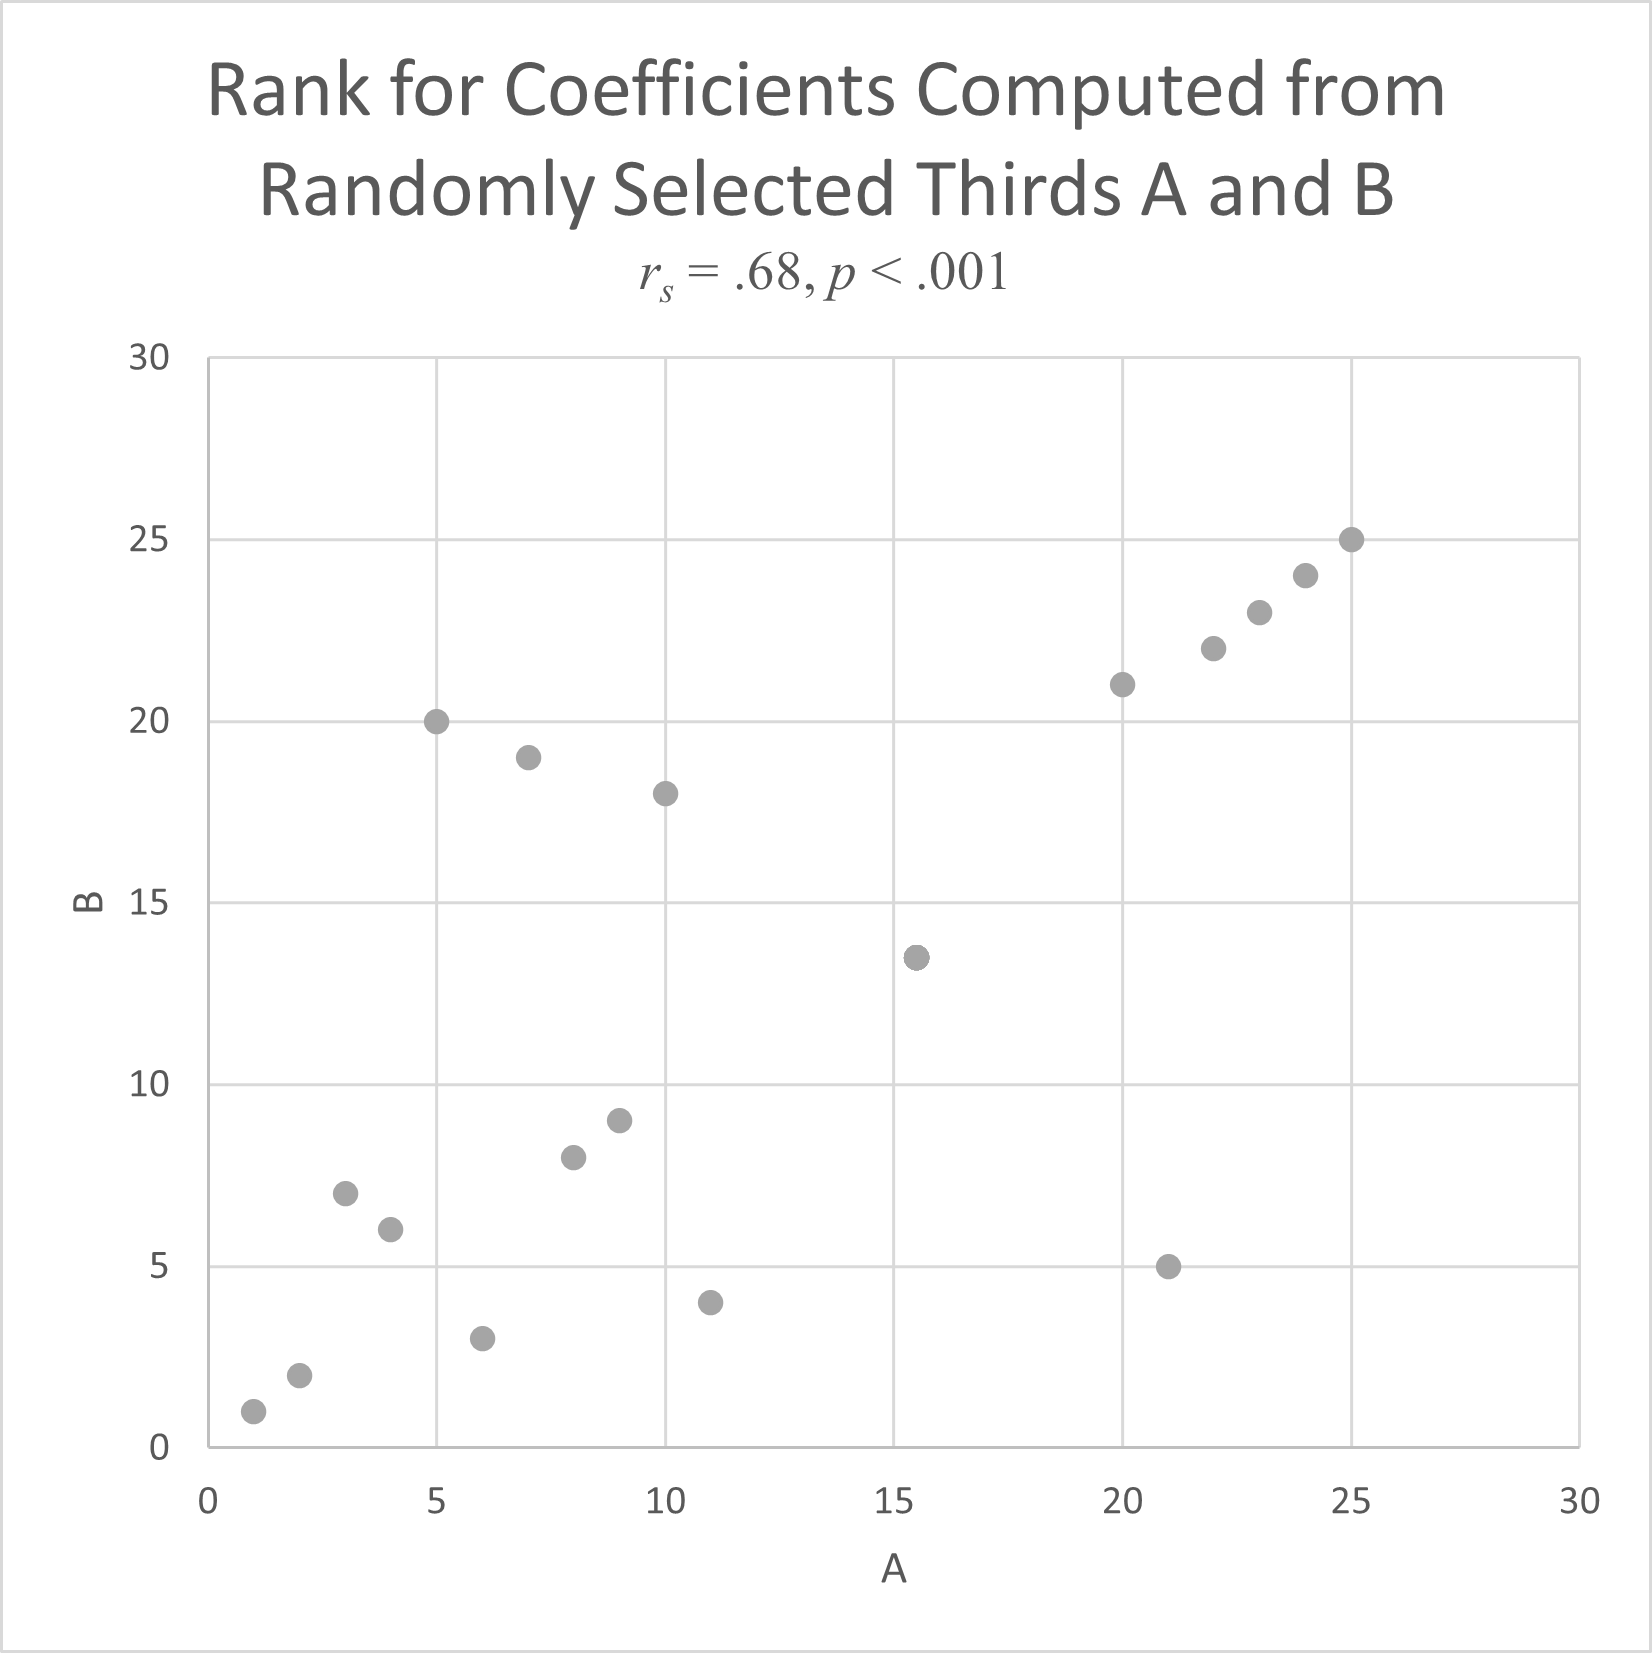
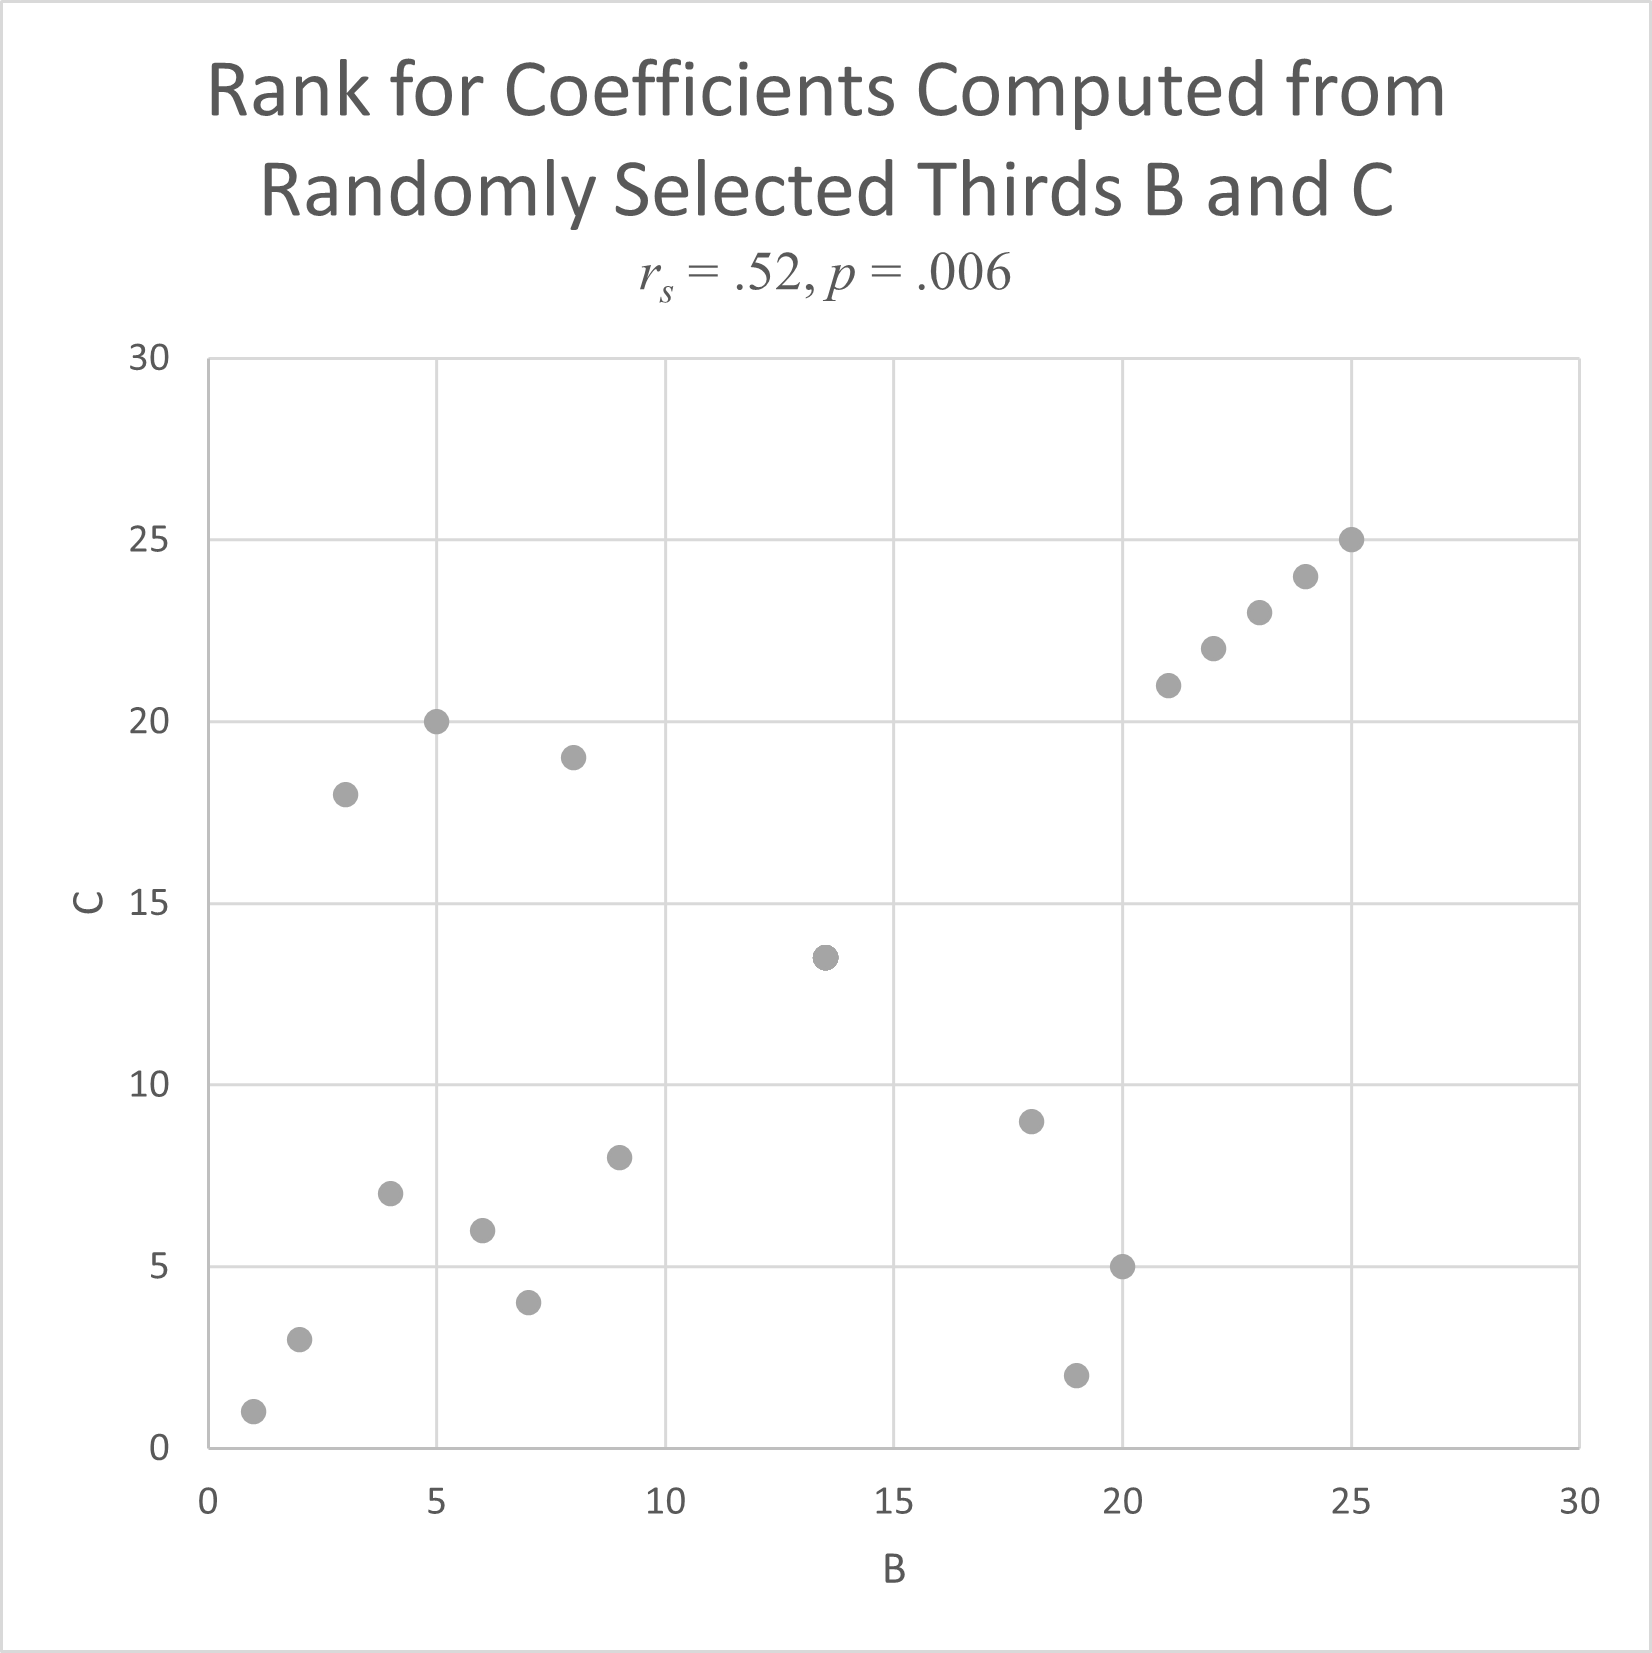
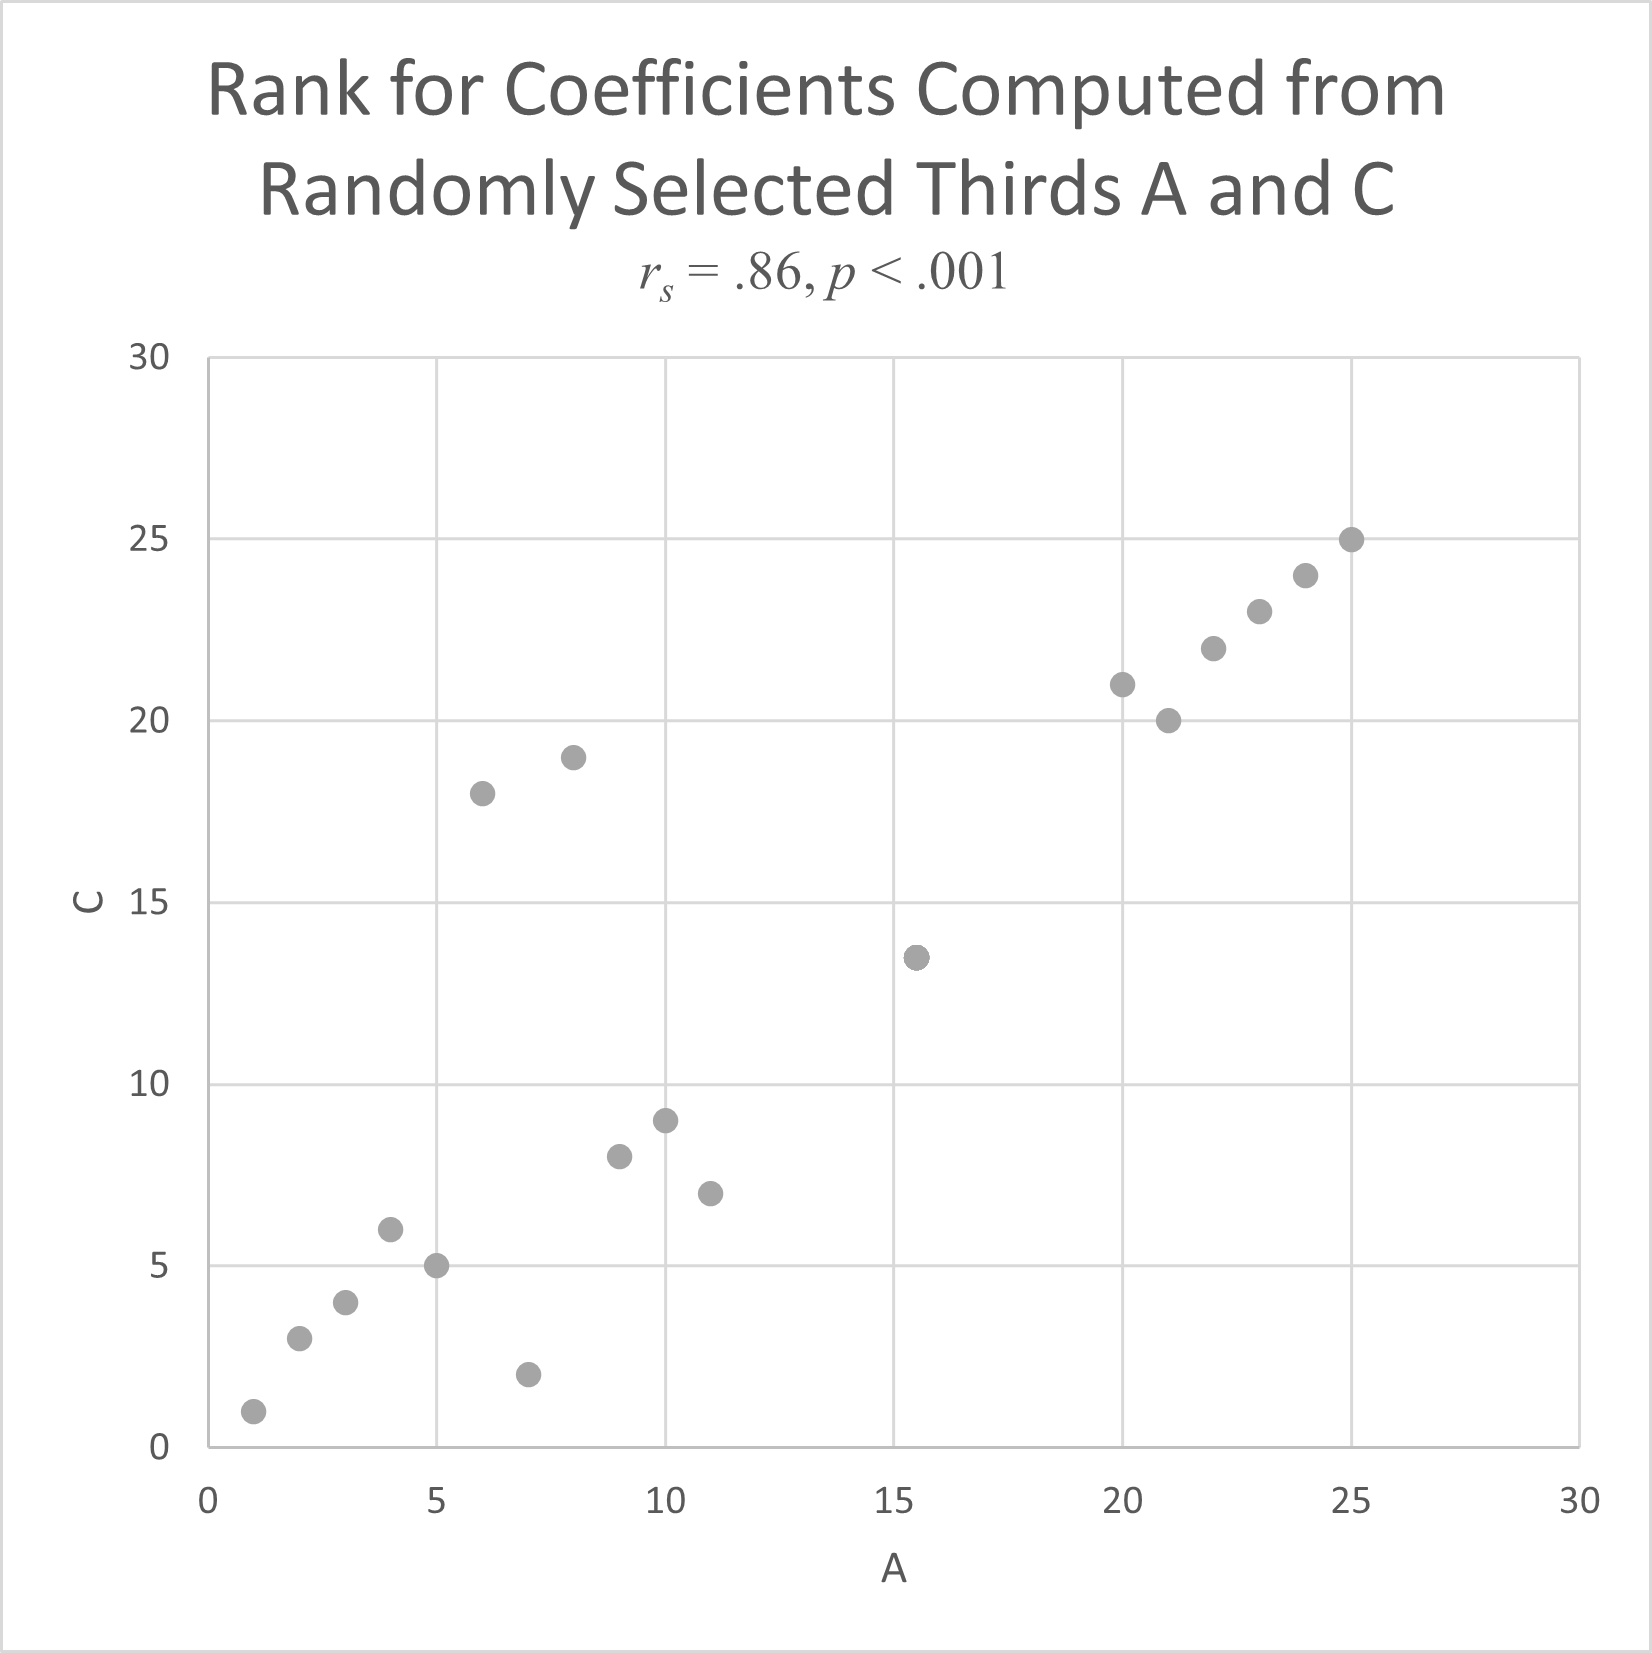
This means, replicating human studies are able to explain ~25% of the variation in human decisions, equivalent to an r_{s} of at least 0.52. This is our Bioequivalence threshold. Meaning, if our experiments show an r_{s} of at least 0.52, our results are statistically indistinguishable from human results.
How to interpret Correlation Coefficient Charts
The Spearman rank correlation coefficient, r_{s}, measures agreement between two experiments by comparing the order of values in their data sets.
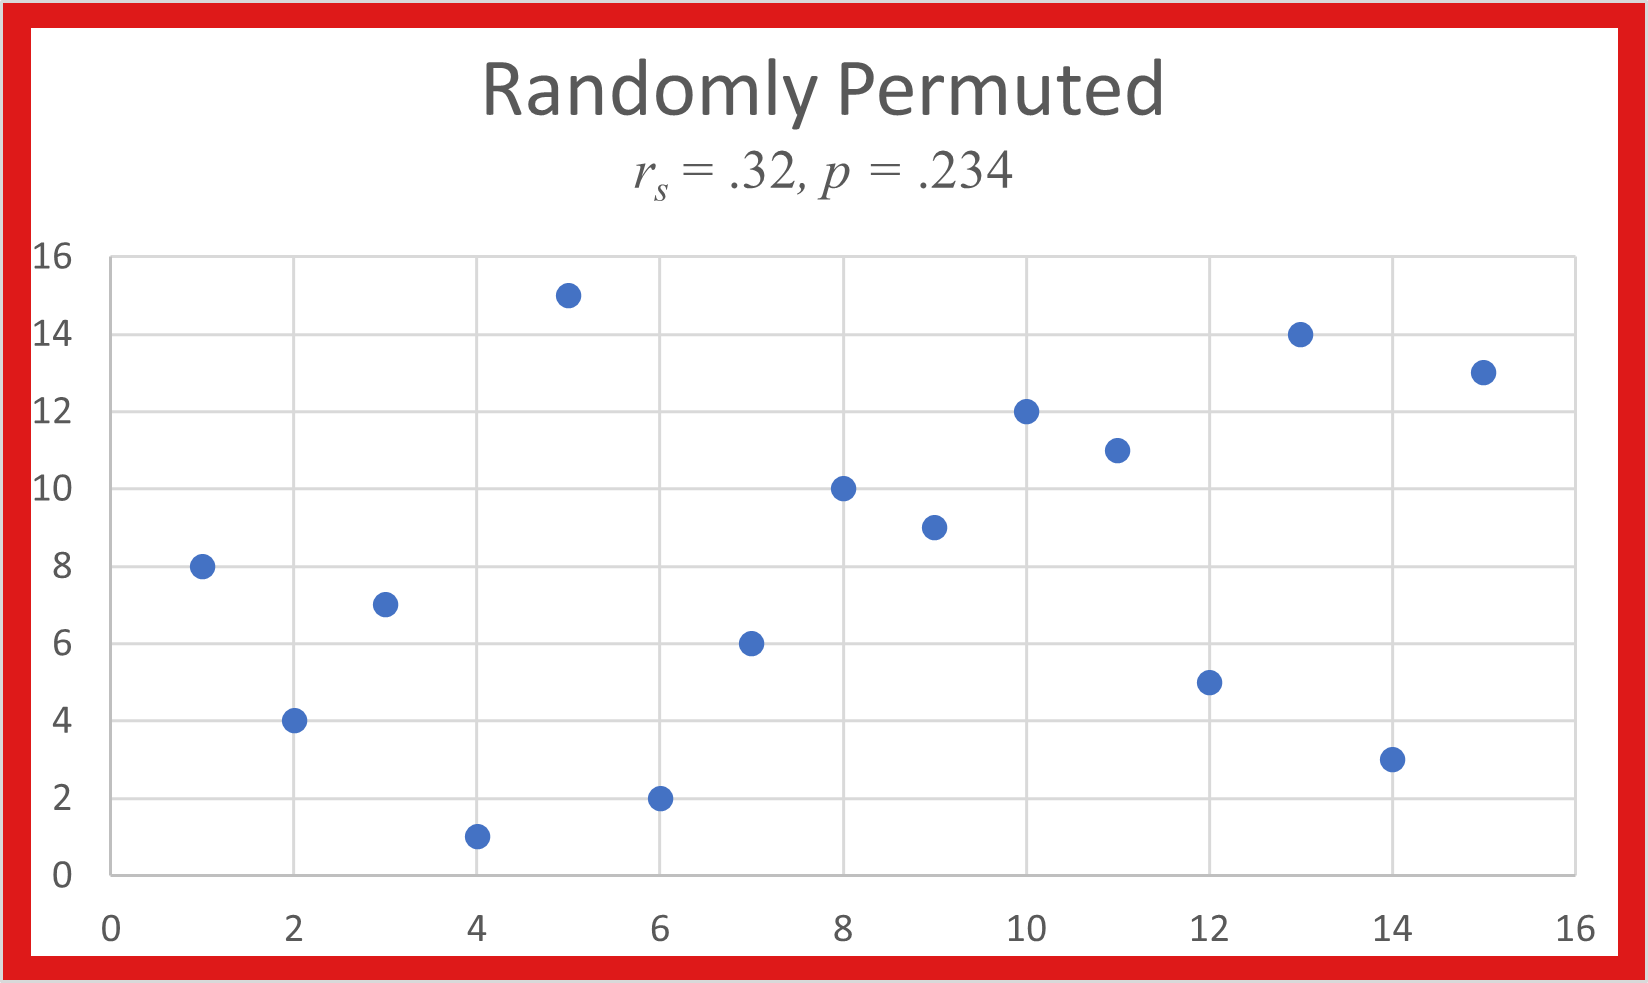
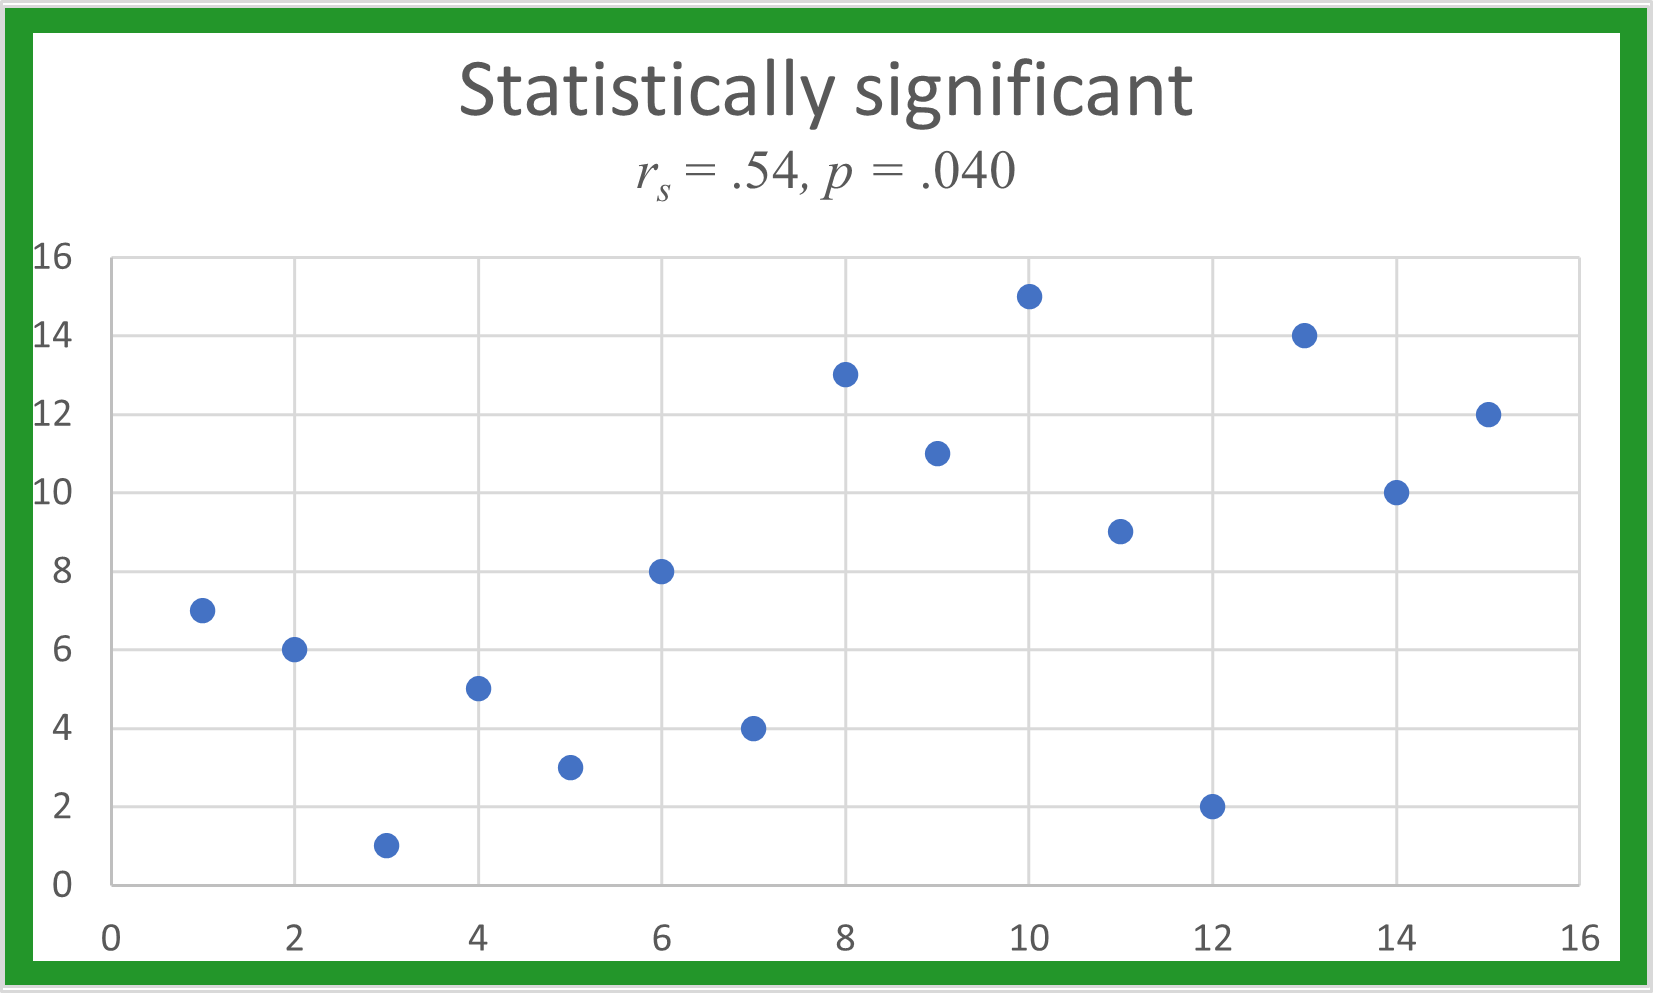
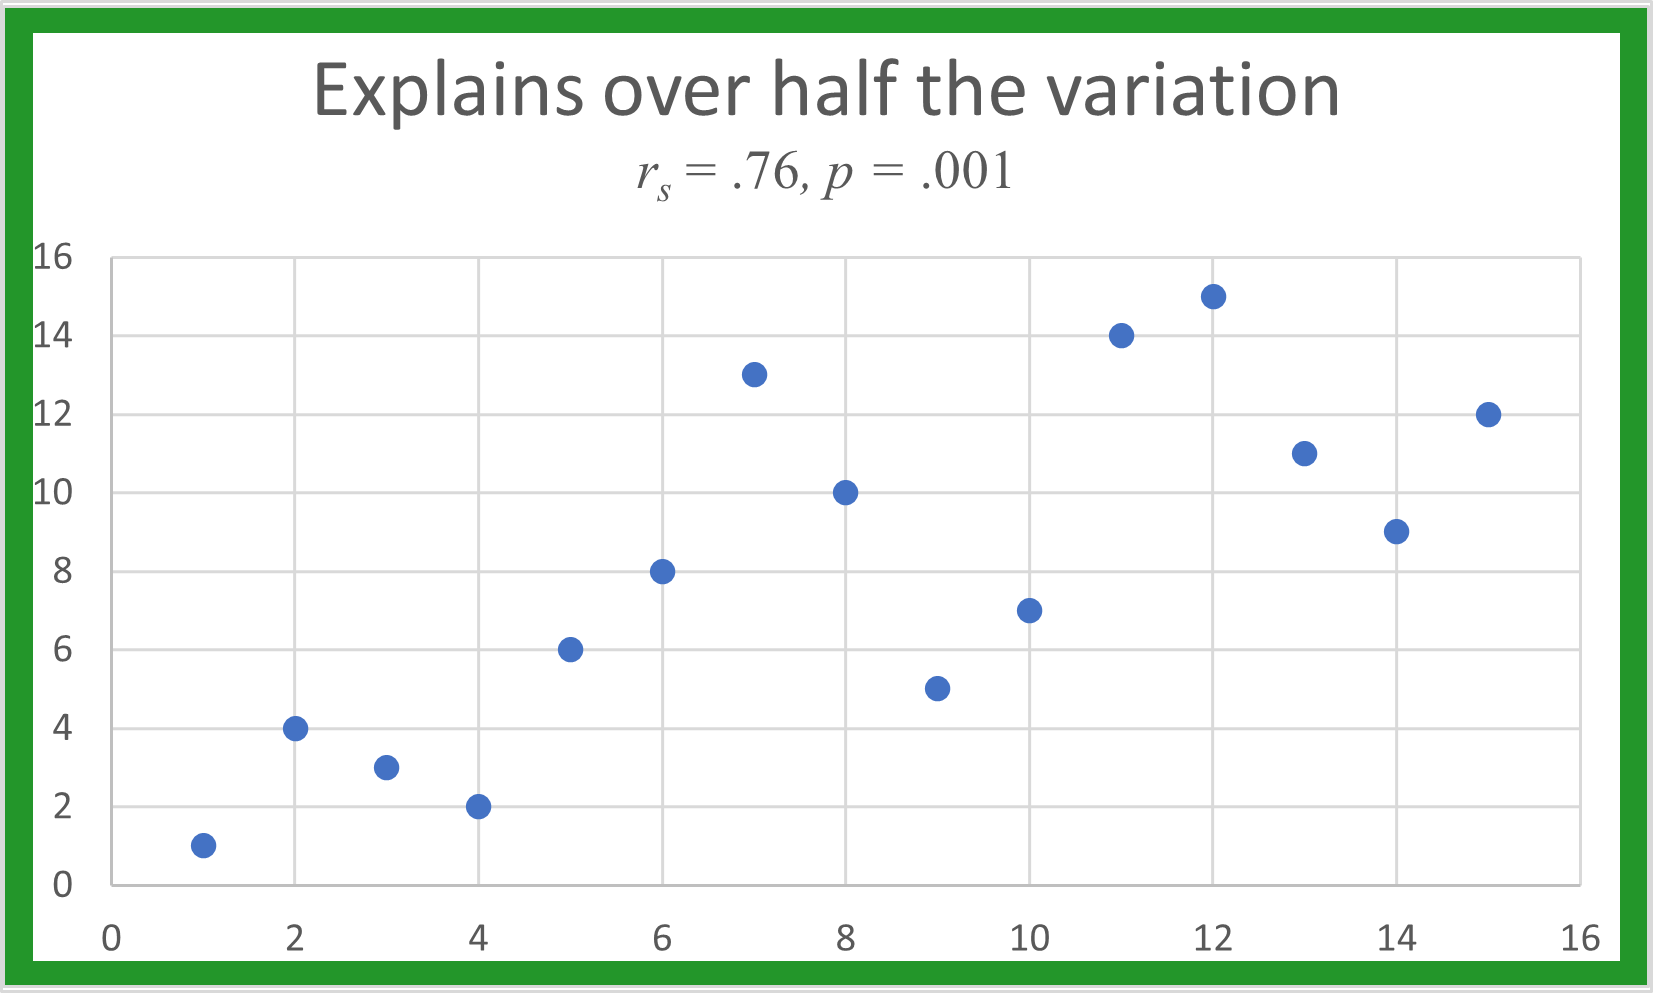
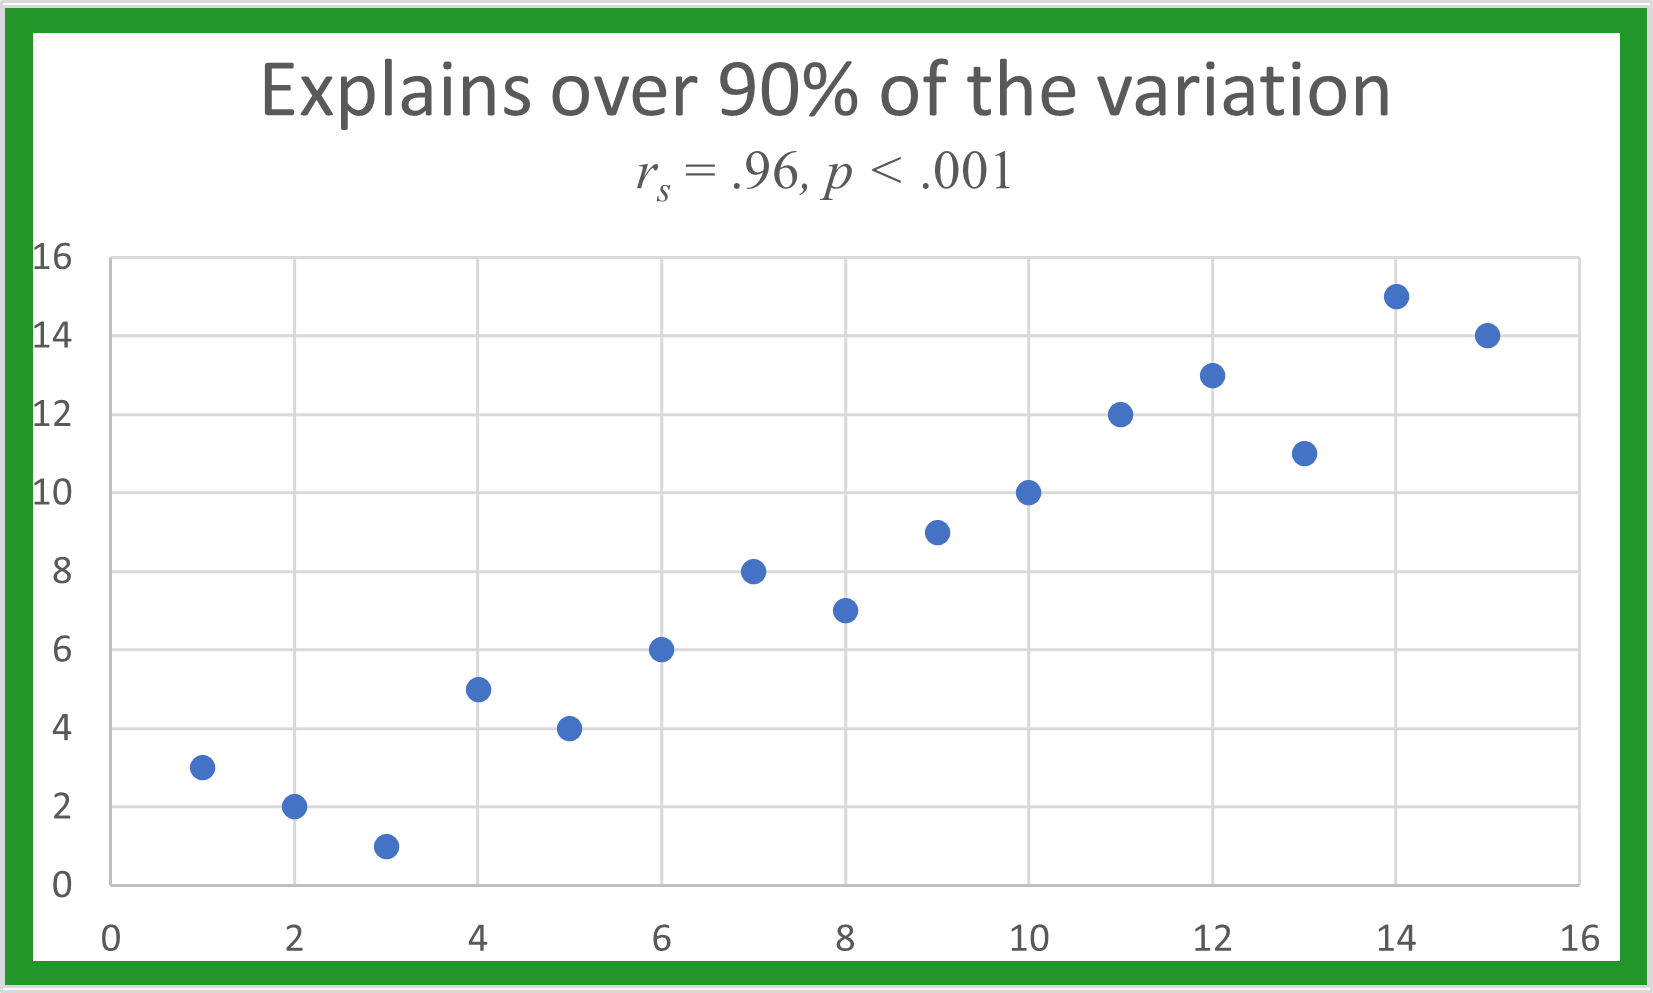
Its square gives the percent of variation in one data set that the other data set explains. Ranks for simulated data sets are plotted below with their r_{s}. When the is below .52, there is no real pattern between the two ranks.
As r_{s} increases, a linear pattern begins to appear. The higher the r_{s} value, the more linear the plot, and the better one data set predicts the other.